
Men’s and women’s volleyball has different characteristics. Everyone knows that. But exactly how different? I’m glad you asked. I scrounged up the complete dataset of matches of the 2019 men’s and women’s FIVB Volleyball Nations League** and put them in the Science Untangled reporting app. This is what I discovered.
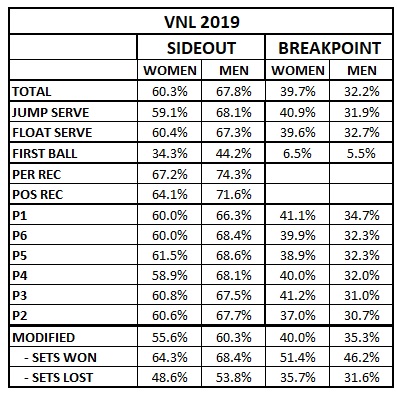
Sideout / Breakpoint percentages – From the table of various sideout measures we can see that across the board women sideout at a lower rate than men. The biggest difference being in the First Ball Sideout (FBSO) rate. For men the worst rotation is P1, with the opposite on the left, receiver on the right. For the women it is P4, the most difficult position for setter penetration. But the difference between best and worst rotation is about the same, 2.6% v 2.3%. On the other side of the ball women score more points from aces than men, which I must admit surprised me. P1 is by far the best point scoring rotation for men, and almost the best for women (setters are the best servers?), while P2 is universally the worst point scoring rotation. The difference between best and worst is again about the same, 4.2% v 4.1%.

Attack percentages – As expected there is a fairly large difference in attack percentage for the various phases between men and women. Interestingly, the error rate is similar overall, although men make more errors in transition. The block rate for men is higher, which is as you would expect using this measure (block points as a percentage of opponent attacks). Other block measures can be different however. Blocks/set (one of the worst statistics ever devised) is typically higher for women. The defence measure (ATT/D, defined as transition attack opportunities created per opposition attack) is much higher (almost double) for women. After there are many, many more rallies in women’s volleyball.
Rally Length – I don’t have an easy measure of rally length, but I can fairly simply calculate the percentage of rallies that contain two net crosses or less. That is, rallies that end after the serve (one net cross) or the first attack attempt (serve reception, two net crosses). In men’s VNL 71.1% of rallies finish in two net crosses or less. In women’s VNL the number is 58.2%. It should come as no surprise to you that there are more rallies in women’s volleyball.
In the next post, I will run some simple correlations to find out if different parts of the game are more or less important between the two groups. I can already tell you that some of the results surprised me. As a teaser, I will let slip that serve and reception are not highly correlated to success for women.
Tagged Volleyball Analytics, Volleyball Statistics, 2019 Volleyball Nations League, Science Untangled
**For the record, the files (251 matches in total) come from different sources and have not been individually controlled. There may be a variety of different scouting conventions used, not least between men’s and women’s teams. However, for the purposes of this overview (ie informal comparison) we can assume the basic measures are valid. Except for errors. Many (but not all) women’s scouts seem to use B= and B/ differently to men’s scouts.
The total of 82 practical Coaching Tips can be found here and here.
Read about the great new Vyacheslav Platonov coaching book here.

One comment