
I have been writing some posts on statistics for the current Plus Liga season, blocking, more blocking, even more blocking, setting, setting standards, serving and more. Most of the time I have tried to find different ways to look at things, and also to showcase how amazing the Science Untangled apps are. This week I opened up to questions from people who follow me on social media. It was a fun exercise. Not everything asked was possible, but a lot of things were and the answers are, as always, interesting. For the record the apps are incredibly easy to use and can find out (nearly) anything you want with 3 or 4 clicks. They only need well recorded data and don’t need complicated custom codes to get results. They are enormously time saving and very reasonably priced. Test them out for yourself. Everything that follows was a question asked through social media and calculated from these apps. Each question took much less time to answer than to transcribe into tables or to crop the screenshot.
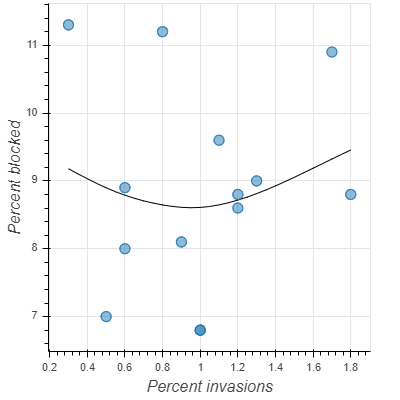
Do teams who touch the net more times have better block efficiency? In other words, is it worthy to be more “aggressive” in block?
We have two graphs below. One graphs net touches against block percentage, the other against opponent kill percentage. Teams who touch the net more, do not have a more effective block.

How do outside hitters hit after their own reception compared with when they do not receive?
It is always interesting to see which players are better and/or worse after their own reception. Take into account that outsides typically have less attempts after their own reception. The lesson is don’t serve to Szalpuk and Semeniuk.
| PLAYER | + RALLY WIN | RATE | |||
| WITH RECEPTION | SZALPUK 0.812 | SEMENIUK 0.756 | LIPINSKI 0.700 | CEBULJ 0.696 | SCHOTT 0.692 |
| NO RECEPTION | LIPINSKI 0.743 | SEMENIUK 0.709 | SLIWKA 0.709 | EBADIPOUR 0.695 | ROUSSEAUX 0.673 |
| TOTAL | LIPINSKI 0.737 | ORCZYK 0.722 | SEMENIUK 0.715 | SLIWKA 0.710 | ZALINSKI 0.710 |
How does score affect serving efficiency?
This one is an interesting one, and one that I had been thinking about myself. For crunch time, it is worth remembering that the sample size is small, and better teams have less actions in crunch time than others. If you are looking closely, Gladyr is an interesting case. For the record between 9-16 his exp BP% is 0.369. His ace / error percentages for the three periods are 0-8 19.3% / 24.6%, 9-16 14.9% / 25.5%, 17+ 25% / 14.3%, crunch time 37.5% / 0%. I’ll just leave that one as it is.
| SCORE | SERVER + exp BP% | |||
| 0-8 | FILIPIAK 0.445 | GLADYR 0.416 | BUTRYN 0.387 | CEBULJ 0.386 |
| 9-16 | KACZMAREK 0.443 | JANUSZ 0.411 | MALINOWSKI 0.406 | LAPSZYNSKI 0.400 |
| 17+ | GLADYR 0.453 | SLIWKA 0.437 | MALINOWSKI 0.430 | FILIPIAK 0.418 |
| CRUNCH | GASIOR 0.416 | JANUSZ 0.406 | EBADIPOUR 0.378 | SAPINSKI 0.371 |
| TOTAL | GLADYR 0.407 | MALINOWSKI 0.403 | BOLADZ 0.374 | TAVARES 0.374 |
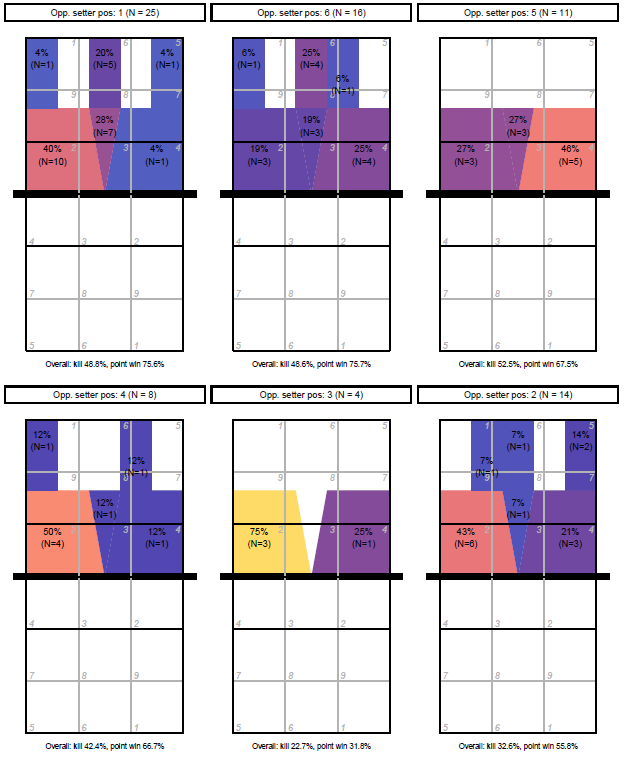
Are more tips were made to position 5 when the middle blocker was backrow instead of the libero?
That is in opposition rotation P2 and P5. There was one situation where this was true; with the attack from position 3 as in this picture on the right. With the attack from the left and right side there were less tips to the middle blocker than in the other rotations. Click on the graph to enlarge

Do setters set position 4 or 2 when they are in P1 and how effective is it?
They set more to position 2 but position 4 is more effective. The lesson is, as always, opposites are better at spiking than receivers are at spiking. Click on the graph to enlarge.
What is the difference between reception for jump serves and float serves?
Jump float serves are clearly easier to receive (exp SO%) and result in more sideouts (modified SO% excludes service errors). Overall the difference is smaller due to the large number of errors from jump serves, but float serves are still easier to sideout from. The lesson is float servers can afford to serve with more risk.
| SO% | mod SO% | exp SO% | |
| JUMP SERVE | 67.9% | 0.584 | 0.588 |
| JUMP FLOAT | 69.3% | 0.667 | 0.660 |
Do setters tip more in P2 compared with P4 and P3?

No. They tip more in P3.
There are a few more questions, that I will have to get back to you on. Hopefully this is enough to be going on with…
Tagged Volleyball Analytics, Volleyball Statistics, Plus Liga, Science Untangled, 2020-21 Plus Liga
The total of 82 practical Coaching Tips can be found here and here.
Read about the great new Vyacheslav Platonov coaching book here.

3 comments