
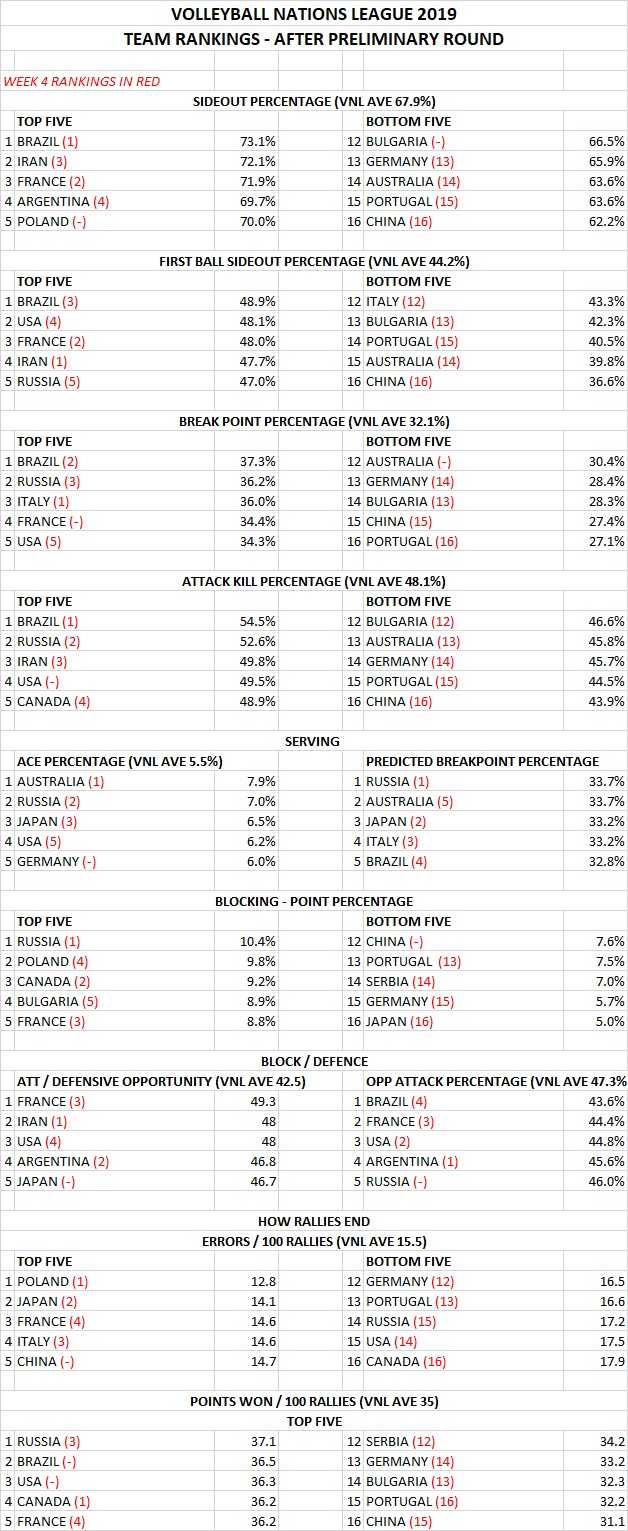
Here are the final team statistics for this year’s VNL after the preliminary round, ie after every team has played against every other team. As always there are some interesting things. Sideout percentage is important. So is breakpoint percentage. Stopping the other team from scoring in attack is pretty important. Scoring points from blocking and serving is not that important. Having a low error rate isn’t as important as scoring points.
There is volleyball in a nutshell 🙂 🙂 🙂
All statistics are compiled using the Science Untangled reporting app, which is one among the suite of apps developed by Ben Raymond. If you want to fiddle around with the statistics yourself, he has made a mini version of this app using just this data. The link is here.
Week 4 is here. Week 3 is here. Week 2 is here. Week 1’s list is here. All VNL 2019 team and player lists are here.
Tagged Volleyball Analytics, Volleyball Statistics, 2019 Volleyball Nations League, Science Untangled
The collection of Coaching Tips can be found here.
For more great coaching tips, check out the Vyacheslav Platonov coaching book here.

One comment