
Having spent some time watching and studying the Italian Superlega playoffs, I wanted to write some kind of analysis. My first thought was, as the title suggests, to explain exactly why Perugia won. So I took the stats for the semi finals and finals and ran them through my models1. Given that Perugia won those two series 3-0, it will not surpise you to learn that the process was short. Perugia won because they were better. Better in (very nearly) every single area. As always, all analysis is done through the Science Untangled suite of apps. You know you should be using them.
To summarise, Perugia’s Sideout Value Added2 was 3.5%. For the other top four teams, Verona was 1.6%, Civitanova 1.0% and Piacenza -3.4%. Perugia also had the best reception. They took the platform (pun intended) provided by having the best reception and added value through their offensive system (i.e. the combination of tactics, setter and attackers).
In the break point phase, Perugia’s Breakpoint Value Added was 2.2%3. All of their opponents had a negative value added, meaning Perugia’s block and defence system was the only one who could take advantage of their serving at even a break even level. Civitanova was -1.9%, Verona -2.4%4 and Piacenza -2.5%. Please don’t be shocked to learn Perugia also had the most effective serve (and lowest ace rate 🤔). They took the platform (pun doesn’t work here) providing by excellent serving and added value through the defensive system (i.e. coordination of block, defense and transition attack).
So in summary, Perugia won because they were way better. While that is hardly a groundbreaking analysis to anyone who watched the actual games, I did find something that is really interesting (to me).
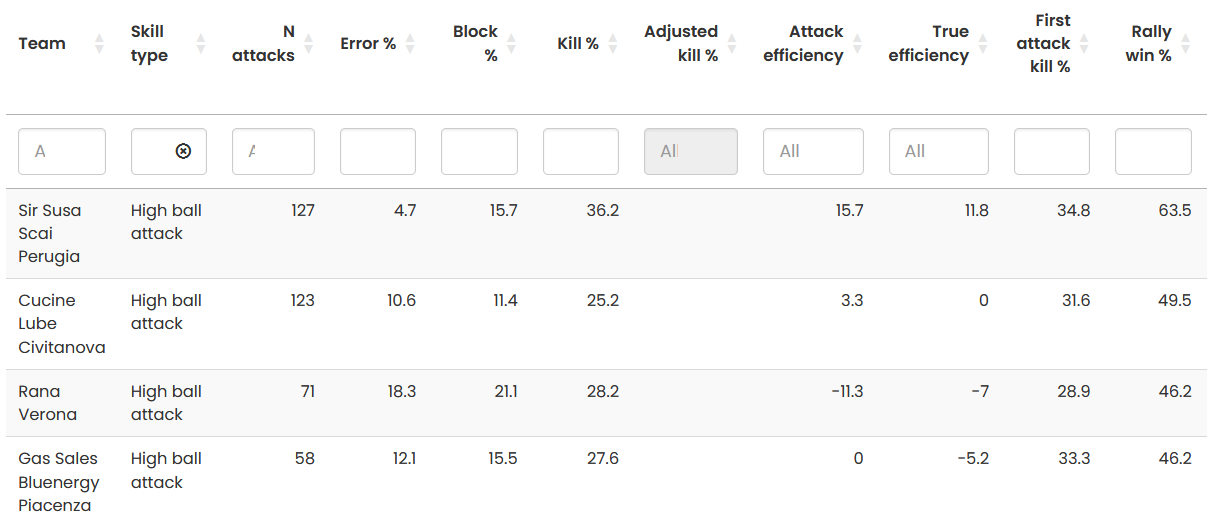
Traditionally, Italians place a very high stock in high balls; the attack, block and management thereof. The ability to attack high balls has often been seen as the make or break skill for success in the Italian league. And it is in the high ball analysis that things getting really interesting / weird. Perugia were by far the best high ball hitting team in the top four. To score on 36.2% is an excellent outcome, as it is to win 63.5% of rallies5, both would almost always ensure success. But what is surprising is how poor (overwhelmed?) the other teams were in that area. To score in less than 50% of those rallies is really unusual even for ‘bad’ teams. Verona in their semi final series had an attack efficiency of -11.3%!! It is a small sample size, but I am confident anyone who looked at their roster would not believe that statistic.
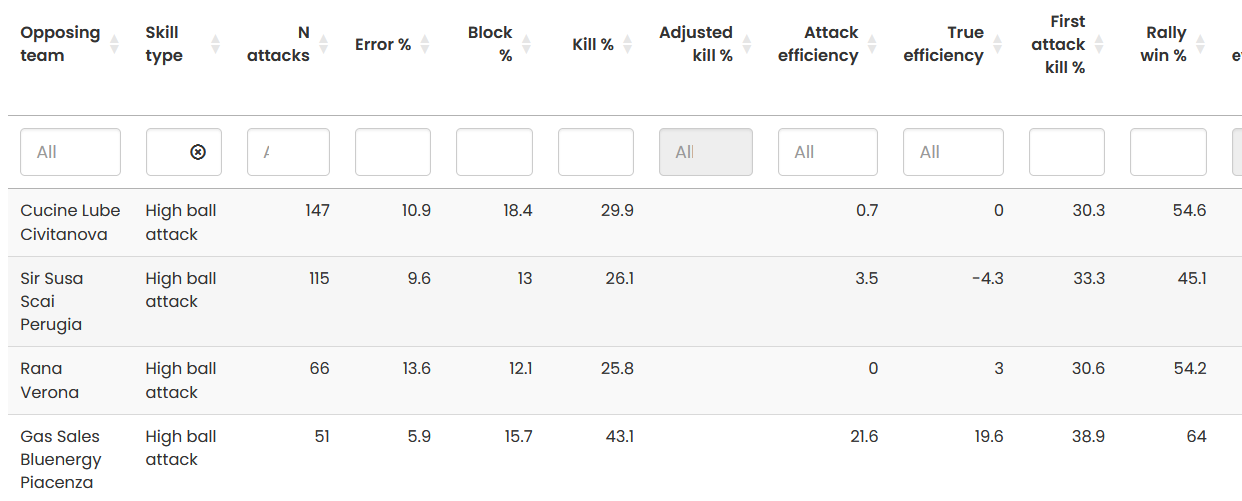
If we flips courts and look at high ball defence we see more unusual results. We see that the top three teams had similar attack percentage against, but in terms of rally win rates, opponent teams won less than 50% of rallies in which they hit a high ball against Perugia. Perugia were by far the best team at defending (and counter attacking) high balls.
So there you have it. Perugia won because they were just better, but they were especially better once both teams got out of system. Then they were waaaayyyy better.
One more thing about high balls. I did think I saw was a trend to setting difficult high balls not to the outsides, but to the middle of the net. And it was not the middles being ready to hit, but the outsides and opposites preparing to hit balls a long way from what we normally expect to be their hitting window. Something like this.
I can’t say for sure if it’s a new trend or tactic, but it happened often enough that I added a combination code to my DataVolley database. It is something I will be watching out for.
- I don’t have any actual ‘models’, it’s just a word that seems to be popular right now. ↩︎
- The difference between modified SO% (SO% excluding serve errors) and expected SO%. Expected SO% is the SO% we would expect on the basis of pass quality, and so the difference between modified and expected SO% shows us the effectiveness of the other components of sideout phase play: reception attack, and to a lesser extent block, defence and transition attack, https://marklebedew.com/2024/08/24/olympic-analysis-defensive-rating/ ↩︎
- The difference between actual and expected BP%. Expected BP% is the BP% we would expect on the basis of serve quality, and so the difference between actual and expected BP% shows us the effectiveness of the other components of breakpoint phase play: block, defence and transition attack. ↩︎
- Verona despite their social media presence, and potential firepower, was simply not able to make break points. ↩︎
- A New Statistic For Attack? ↩︎

Well, nothing to say about the numbers itself. They will be correct. But there is one obvious factor when we talk about Verona. That is performance management over the season.
They had 3 key players more or less so injured that they could not play/perform, who were on court and performing when they won the cup… Darlan, Cortesia and Modzic were by far not close to their best physical shape. Cortesia did not hurt so much, as the other middles did a good job, but latest on high ball even the best setter cant save their ass any more, when you have a half limping guy and one player, who is a solide player, but not the one who takes on a Perugia tripple block, or even Lube. Who both even with setter front have formed strong and high…
LikeLiked by 1 person