
Last year, for my own personal amusement, I started to post a different version of player rankings from the official FIVB version using statistical categories that, I think, are more interesting and accurate and useful. This year I thought I would add some team statistics that might help watching on TV.
All statistics are compiled using the Science Untangled reporting app, which is one among the suite of apps developed by Ben Raymond. If you want to fiddle around with the statistics yourself, he has made a mini version of this app using just this data. The link is here.
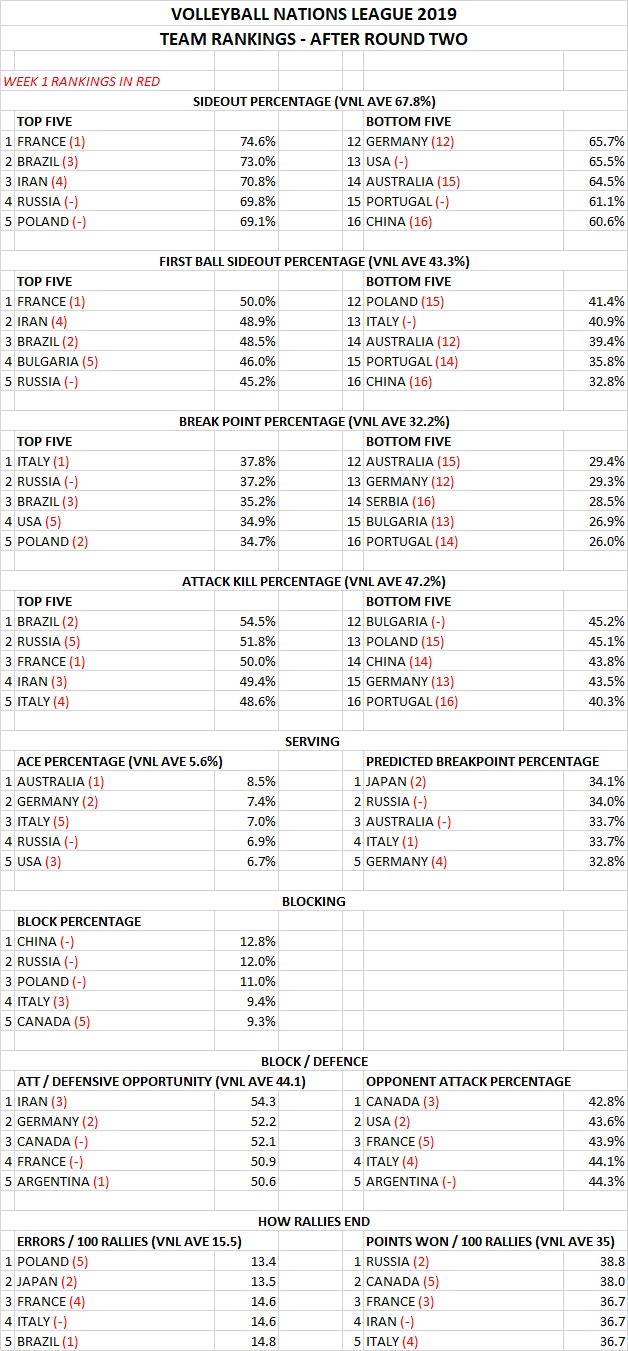
A couple of interesting notes, teams whose results are led by sideout phase (eg France, Iran) and those whose focus is break points (eg Italy, USA). And of course teams who are good at both (eg Brazil, Russia). Serving doesn’t necessarily have a strong relationship with break points (eg Australia, Japan). Of the top five teams in error reduction, only one is in the top five of the league ladder. Of the top five teams in points scored, three are in the top five of the ladder.
Last week’s list is here. All VNL 2019 team and player lists are here.
The collection of Coaching Tips can be found here.
For more great coaching tips, check out the Vyacheslav Platonov coaching book here.

4 comments