
Last year, for my own personal amusement, I started to post a different version of player rankings from the official FIVB version using statistical categories that, I think, are more interesting and accurate and useful. This year I thought I would add some team statistics that might help watching on TV.
When I have a few extra minutes, I will put up some other interesting takes. Here are some breakdowns of what is happening in the sideout phase. As always, the statistics are compiled using the Science Untangled reporting app, which is one among the suite of apps developed by Ben Raymond.
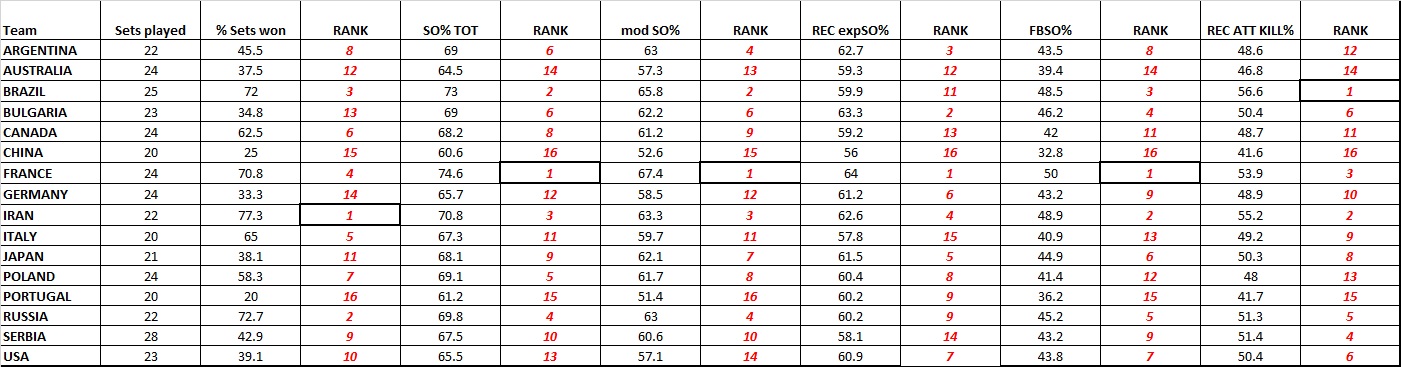
This chart shows some of the basic sideout related stats. You can see how sideout relates to set wins. Modified SO% is sideout minus service errors. The difference between modified SO% and expected SO% should be some indication of the quality of the setter and spikers.
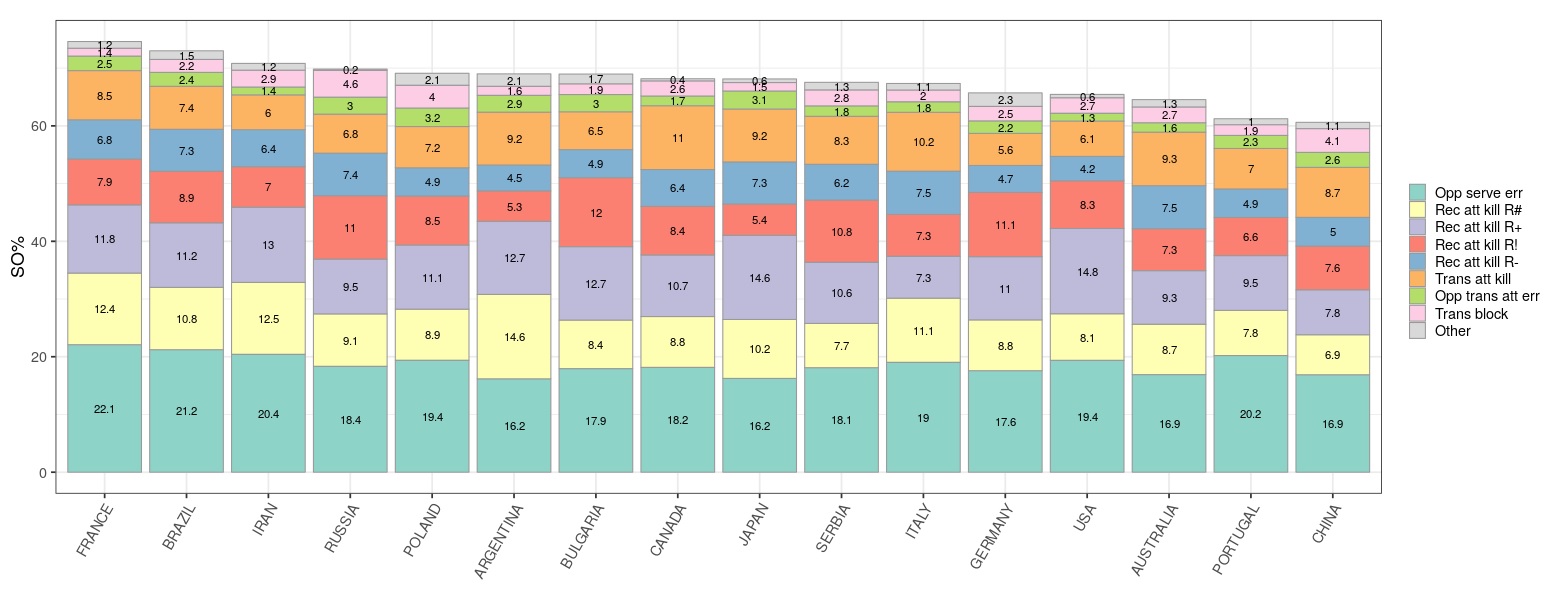
This chart is copied directly from the app, and shows how each team wins its sideouts.

3 comments