
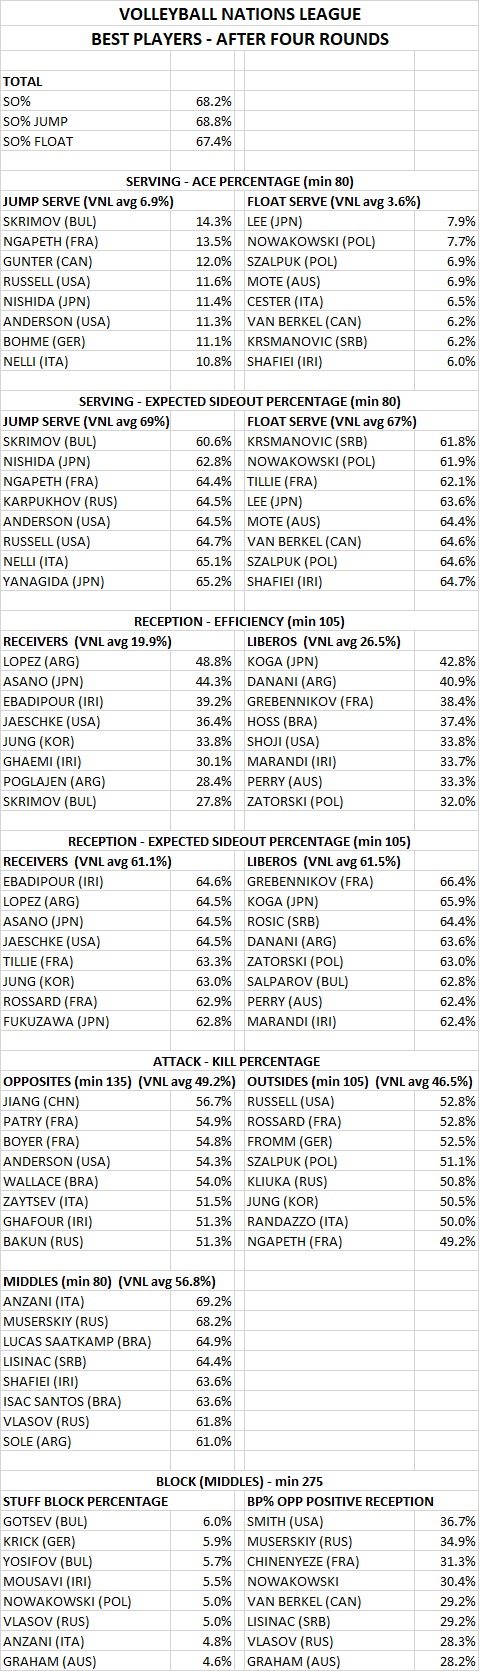
Here are the Best Players in VNL after four rounds. After four rounds each team has played 12 matches and you would expect the lists to start to stabilise. However, coaches are still rotating their players in and out of the team each week, leaving some good performers not having enough attempts to ‘qualify’ for the lists, so individual sample sizes are often not that high. Forgive the fairly awful formatting. I am putting this together in actual airports. This week I have expanded the lists to include the top 8 in each category.
One interesting, to me, note is that the sideout percentage is lower for float serves than it is for jump serves. This is the first time I can remember that this has happened, although the gap is closer than after the last round.
I have added two categories ‘Expected Sideout Percentage’ for both serving and reception. This uses the expected sideout percentage for each serve and reception result as the scale for measuring each skill, instead of the old 3, 2, 1, 0 scale. The result is an expected sideout percentage which includes more information than the ace percentage or efficiency.
Ben Raymond has done up a basic tool that lets you look at all players and sort your own lists. It doesn’t have the same detail as the one I am using, but I’m sure it have everything you can think of. You can find it here.
The collection of Coaching Tips can be found here.
Read about the great new Vyacheslav Platonov coaching book here.

One comment