
In the course of my job, I have to study some stuff about volleyball. A lot of the stuff is analytical in nature, or at least statistical. Because I am doing it anyway, I often post the results here in the name of education. For example a comparison of Europe’s Top 5 Leagues, and some best player and team analysis for 2018 VNL and 2019 VNL.
I am studying the 2018-19 Polish Plus Liga. The data set contains 186 matches which includes every match (except one :() from the normal round, all cup matches between Plus Liga teams and all playoff matches where medals were at stake (ie not including position playoffs after 3rd). As always the data are generated by Ben Raymond’s incredible apps.
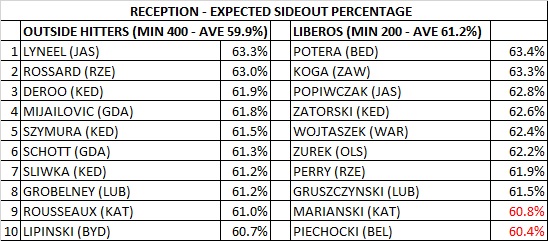
RECEPTION
For clarification, the statistic I use for reception is the ‘expected sideout rate’. This is the rate at which you would expect to sideout given the quality of your reception. The expected sideout rate based on the receiver’s pass ratings and the dataset-wide sideout rates by rating. For example, ‘perfect’ receptions might correspond to a dataset-wide sideout rate of 0.7, and ‘poor’ to 0.4. If a given receiver had one ‘perfect’ reception and one ‘poor’ one, their expected sideout rate would be 0.55. So the ‘expected sideout rate’ is specific to a particular league. It is calculated automatically in the report app. It is worth noting that an receiver receives 20-30 serves in a 4 set match. Which means when reading the numbers below you should consider that a 1% difference in expected sideout rate, means 1 (one) potential sideout every 3-4 matches. Liberos receive even less. All of this means that there is no actual noticeable difference between any of the these receivers.
Again I have split the lists by role to ensure we are comparing like to like. As you can see, as a group liberos are better at receiving than outside hitters. The numbers in red indicate players who are below the role average. In a fourteen team league, there are a limited number of liberos who reach the minimum threshold, so it is not surprising that players in the top 10 would be ‘below average’. Also not that they are at least comparable with the best outside hitters. What is interesting to me is that players who might normally be considered weaker receivers, and are definitely the targets in their respective teams, pop up in the lists. Whether this is because they get more practice than their teammates so get better, or because the ‘better’ receivers haven’t reached the minimums, or because coaches are bad at deciding who they should target would be an interesting discussion.
Splitting up again by service type you see some differences in who is good at different parts of the game.

Tagged Volleyball Analytics, 2018-19 Plus Liga, Plus Liga, Science Untangled
A collection of 50 Coaching Tips can be found here.
For more great coaching tips, check out the Vyacheslav Platonov coaching book here.

6 comments