
With a little extra time on my hands I have taken started to look at what might be the differences and similarities between leagues, and with it whether there are any structural ‘rules’ in volleyball. Thanks to Michael Mattes and Manlio Puxeddu, who collected the files and Ben Raymond, who wrote the apps that let me crunch the numbers for the whole leagues. The leagues I will focus on are France, Germany, Italy, Poland, and Russia. For these leagues, I have almost full data for the 2016-17 season and I also think these are probably the top 5 leagues right now.
As befitting someone who is incurably curious about volleyball, has done a single statistics course nearly 30 years ago and has a slightly above ‘basic’ level of expertise in Excel, I wanted to try to see if any of these statistics that I have been writing were actually important. To achieve this high goal, I took the set win percentage of each team in each league and correlated that with various statistics I have presented in this series. I used set win percentage instead of match win percentage on the assumption that it was a slightly more sensitive indicator of differences between teams. I am completely aware that using a correlation in this way is only marginally better than just having a list of numbers, but better is better.
One quick note for those interested in / concerned with sample sizes, each league data set has at least 150 matches and around 30,000 attacks.
ATTACK PERCENTAGE v ATTACK EFFICIENCY
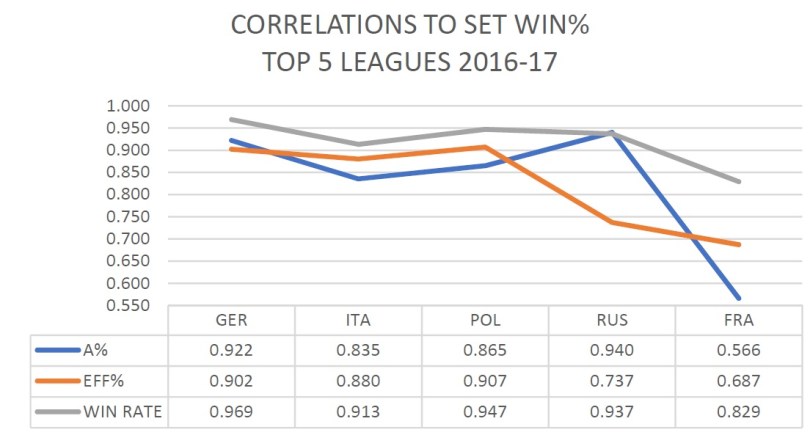
We can see that attack percentage and efficiency are both highly correlated to win rate in 4 of the 5 leagues. In 3 of the leagues the differences were small and in Russia the difference was a little bigger but both measures still correlated highly. In France spiking does not seem to be highly correlated with winning, whichever way you want to measure it. This is a strange result that I will postulate on in a future post when I look at the internal strength of each league.
Interestingly, the rally win rate measure that we introduced yesterday is more highly correlated with winning than the other measures, even in France. It seems that the previously unmeasured balls could well have an impact on the result, which should not be a surprising discovery. There may be better, more accurate ways of measuring those ‘missing’ balls but the rally win rate is particularly easy to measure and doesn’t require any subjective rating of contacts or extra coding of events (similar to the attacks per defensive opportunity statistic approach for measuring team defence).
ERRORS AND BLOCKS
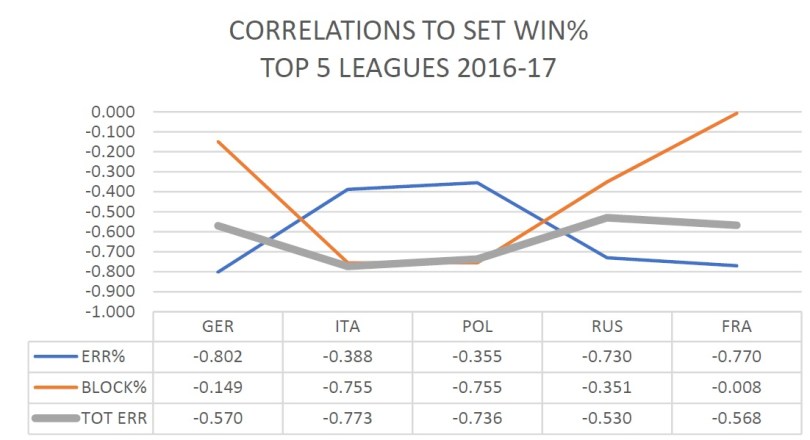
As we know the attack efficiency takes account both direct errors and blocks conceded. The question which of those, or indeed whether one of them, is more important than the other is not one I had spent a lot of time on. Now I have and it seems pretty clear that we can’t make any decisive statement either way. In France it is irrelevant if you get blocked out. In Poland it barely matters if you hit it out. And everything in between. The sum of the two is fairly stable from league to league, but nowhere near as important as attack percentage alone, efficiency or rally win rate.
Please note that as errors are a negative correlation, the lower the number the higher the correlation.
So there you have it. Whatever it is.
For previous posts in this chain click here, here, here, here, here, here, and here.
The collection of Coaching Tips can be found here.
For more great coaching tips, check out the Vyacheslav Platonov coaching book here.


Two questions.
1 – Many stats programs calculate an ‘average’ of the hit effectiveness. Usually a 5 point scale for kill/+ve/-ve/blocked/error. Have you looked at this?
2 – Is there a threshold number of kills or errors below (or above) which teams lose? This is something I think should be part of most statistical discussions. We say that Errors are or are not important, or kills are or are not important. But in reality, if all our hits are errors, then that is the significant thing. Perhaps, and this is just off the top of my head, look at the average number of kills throughout the league, per set. Then investigate the variations above and below this. Or just the average of the winning teams in sets.
LikeLike
Re: 1 – the issue with averaging these is that the hit evaluations are just category labels, without intrinsic numeric values. To average them, one has to assign a numeric value to each. Let’s say we choose to value them 0 (error) to 4 (kill). In that case, one kill and one error would be worth as much as two “negative” attacks; and a blocked attack that is nearly unplayable would be worth as much as a blocked attack that lollipops up for an in-system reattack. The first seems pretty arbitrary and subjective, the second seems like an oversimplification. To reduce the subjectiveness of our assessment (and make the statistical analyses a little more principled) we need to assign numeric values that make sense. One way of doing this is to use a common scale of measurement on which to compare the relative worth of different outcomes. The rally outcome (win/loss) is one possible choice for that scale.
LikeLike
1. I have never liked this kind of scale because a) who determined what the scale is and why? They are just random numbers. b) you need everyone to agree on what is a + and a -, and in reality there are grades of those too. If not everyone agrees, then you can never measure it.
2. You are right of course. When it comes out that errors are not important, what it means is “errors are not important (because everyone in the league makes the same number of errors)”. I like the idea of bringing it down to number of kills you need. Not sure I’ll go there though 🙂
LikeLike
hahaha and what Ben said 🙂
LikeLike
Joe Trinsey is the USA National Team ‘analytics guru’. To briefly explain, going to Ben’s (and my) point, they started to use standards to measure reception instead of 3,2,1. From their league they have the SO% for each quality of the reception. They use that to measure the reception. So the reception, both team and individual, is a probability. What should the sideout level be with this level of reception. Funnily enough I have been using this for serving for years, going back to Berlin. And now that I think about it, my middles always had better predicted SO% on their serve, than actual. The ‘Libero Effect’ was right in front of my face the whole time 🙂
LikeLike
That’s interesting. Without having watched the video it sounds like they do what I mentioned above? Find ‘average’ value and relate performance to this. Is that right?
Regarding the numerical scale, and Ben’s comments, the scale can be anything that makes sense. I agree that the arbitrary 3, 2, 1, 0 scale is flawed, on the other hand, a 2 pass seems like it would be twice as preferable to a 1 pass, and a 3 pass a bit better again. Though a 0 pass is clearly MUCH less desirable than a 1 pass. Regardless, the numerical scale can be determined however you like.
Regarding the + and – definitions. I thought you already had these in Datavolley? The definitions are consistent (ish). There is just no value allocated (which, as stated, can be anything you want).
One last point regarding Ben’s discussion about a block that lollipops up compared to one nearly unplayable, and this is something that I’ve written about before, the outcome is the outcome, we are not measuring degree of difficulty. A loopy gentle topspin serve which lands in because someone fell over while trying to pass it, is worth much more than the best jump serve ever, bouncing off a passer’s shoulder directly to the setter. So, even though we allocate ‘objective’ values to everything, there is still a huge amount of subjectivity involved because we don’t factor the difficulty of the play.
LikeLike