
In the course of my job, I have to study some stuff about volleyball. A lot of the stuff is analytical in nature, or at least statistical. Because I am doing it anyway, I often post the results here in the name of education. For example a comparison of Europe’s Top 5 Leagues, and some best player and team analysis for 2018 VNL and 2019 VNL.
I am studying the 2018-19 Polish Plus Liga. The data set contains 186 matches which includes every match (except one :() from the normal round, all cup matches between Plus Liga teams and all playoff matches where medals were at stake (ie not including position playoffs after 3rd). As always the data are generated by Ben Raymond’s incredible apps.
LEAGUE TOTALS
In the 2018-19 there were 31,760 serves recorded. The breakdowns and basic information is in the table below. For clarification, all topspin serves are classified as ‘jump serves’ and all float serves as ‘jump float serves’. In the case of servers who serve both topspin and float from the same toss (ie a hybrid serve), topspin and float are classified separately.
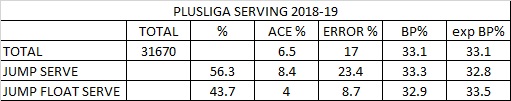
Some interesting points, float serves created worse reception outcomes (ie higher expected Breakpoint %) than jump serves, but a worse actual Breakpoint %. As most middle blockers are float servers, is this further evidence of ‘The Libero Effect’? It is also striking that there is such little difference in the points ultimately generated by each type of serve, especially considering the different emotional responses caused by each.
INDIVIDUAL SERVING RANKINGS
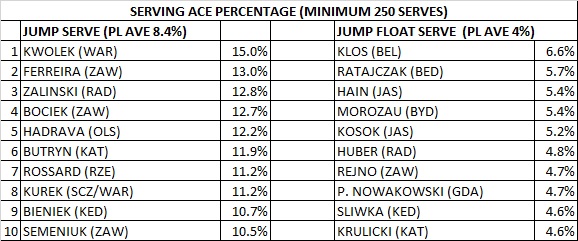
Not surprisingly, jump servers serve more aces than float servers.
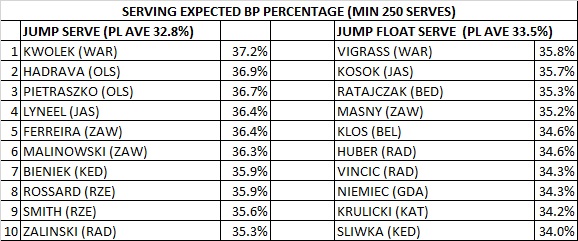
A little bit surprisingly, the best jump servers force worse reception than float servers. Given that overall, jump serves are less effective than float serve this would suggest that there are a lot of jump servers who do not add value to their teams, either by not being effective enough, or by making too many errors.
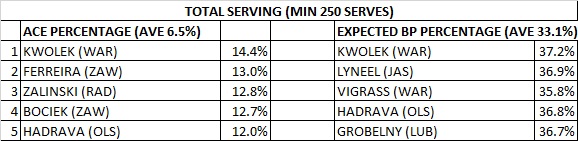
The combination table shows that jump servers serve more aces, but that hybrid servers (ie those who use both topspin and float serves in their repertoires, often from the same toss) are very effective in forcing poor reception. Of the top 5 in expected BP% Lyneel, Vigrass and Grobelny were at least 25/75 in their variation.
Tagged Volleyball Analytics, 2018-19 Plus Liga, Plus Liga, Science Untangled
A collection of 50 Coaching Tips can be found here.
For more great coaching tips, check out the Vyacheslav Platonov coaching book here.


How is Expected BP% calculated?
LikeLike
Using the league wide break point percentage for each serve result. The app calculates it uniquely for each data set. For this men’s top level it varies a bit from season to season and league to league but is roughly
Ace = 1
S+ = 0.45
S! = 0.39
S- = 0.25
LikeLike