
Everyone knows that rotational analysis is the most common analysis of setter’s tendencies. This has been the gold standard of analysis for 40 odd years. Unfortunately rotational analysis is only the tip of the iceberg of elements that go into a setter’s decision making process. For example, the first moment that I questioned how valuable rotational analysis was, was when it first occurred to me while we expected opposition setters to follow their rotational tendencies, we taught our own setters to follow the opponent’s block.
Tracking setter’s tendencies is not easy. Data Volley has the basic information and allows more detailed information to be recorded (setter position, reception position, custom codes) but the analysis of that information is difficult and time consuming. Some software packages have been developed that allow more easy analysis, but still only touching the surface and at a very high cost.
Enter Ben Raymond, our analytics friend who is behind all the analytics posts I have written in the last couple years on timeouts, Top 5 Leagues and VNL best players. He has developed a web based app that takes Data Volley files and digs into the data to find setter tendencies. Among other available filters using simple drop down lists are:
- setter position
- opponent setter position
- setter position on the court
- reception origin
- middle blocker call
- score
- score differential
- set number
- sideout attempt in a series
- players on the court
Frankly, this is an amazing piece of work. It is incredibly simple to use, fast and lets you instantly test and cross reference multiple hypotheses. I think you will have a lot of fun playing around with this and will learn things you never knew.
The link is https://apps.untan.gl/volleyset/
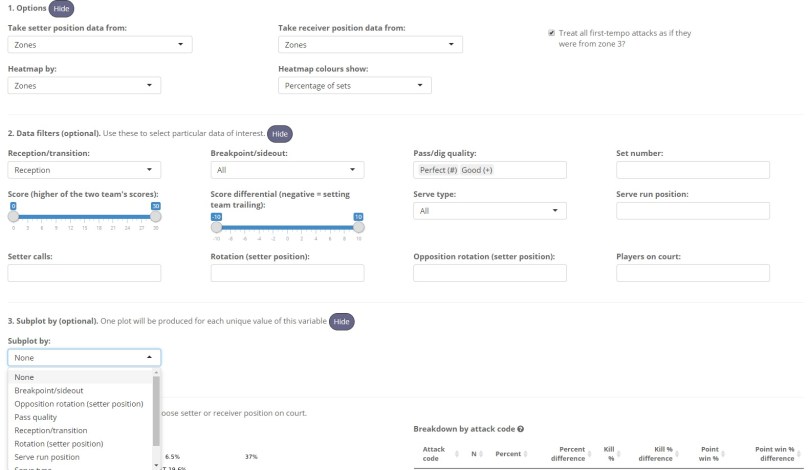
The interface looks something like this.
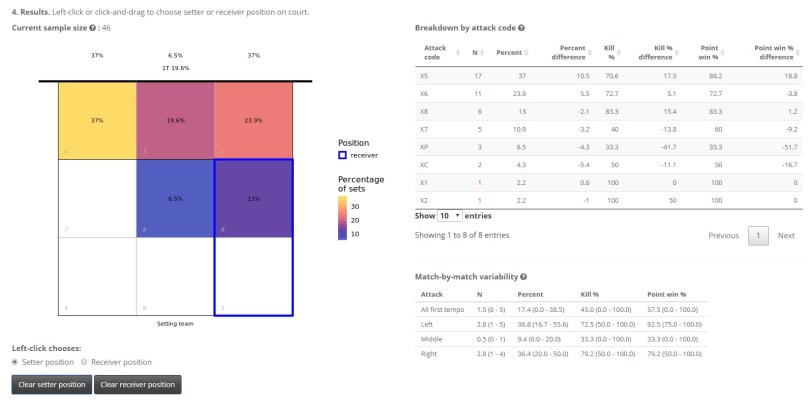
The basic output looks like this, visually displaying the distribution and colour coded.
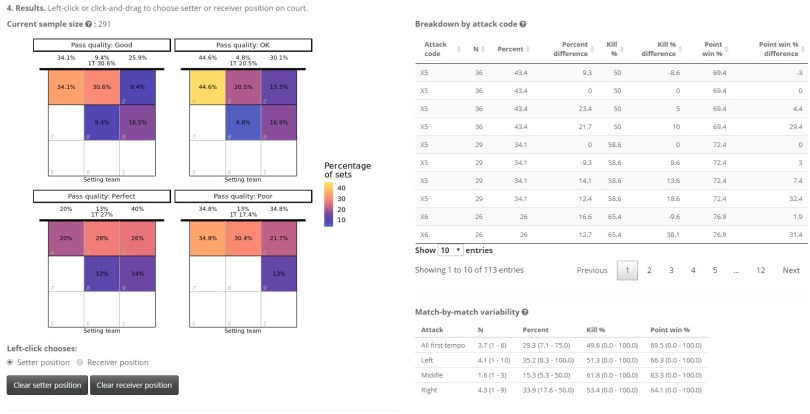
The secondary sub plot list allows multiple results to be shown at once.

4 comments