
The two first points of reference for analysis of performance are the sideout percentange (SO%) and breakpoint percentage (BP%). These two statistics measure actual performance in the two main phases of the game: when the other team serves and when I serve.
SIDEOUT PERCENTAGE / RATE
This is simply the percentage of times a team wins the rally when the opposing team serves. That is, the number of rallies won when the opposing team serves divided by the number of opposition serves. Note this statistic has NOTHING to do with attack.
BREAKPOINT PERCENTAGE / RATE
The percentage of rallies a team wins when they serve.
These two statistics give the basic outline of all performance. To those we can add three more basic statistics.
MODIFIED SIDEOUT PERCENTAGE / RATE
The modified sideout percentage (modSO%) is similar to the SO%, but excludes opponent service errors. It is the number of rallies won when the opposing team serves divided by the number of receptions. NOTE: There is no equivalent ‘modified’ breakpoint percentage.
RECEPTION
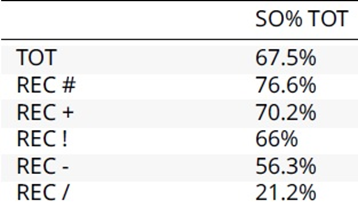
The main statistic for following reception is the expected sideout percentage (expSO%). This is expected sideout rate for the team based on the quality of the reception (i.e the receiver’s pass ratings) and the dataset-wide sideout rates by reception quality. For example, the accompanying table represents the actual sideout ratings for a particular league. If player A receives two serves perfectly (#), four serves well (+), one serve ok (!) and overpasses one serve (/) then the calculation is:
(2 x 0.766) + (4 x 0.702) + (1 x 0.660) + (0 x 0.563) + (1 x 0.212) / NUMBER OF RECEPTIONS
exp SO% = 0.651
NOTE: The sideout percentage for a service ace is 0.
SERVING
The main statistic for following serving is the expected breakpoint percentage (expBP%). This is expected breakpoint rate for the team based on the quality of the serve (based on the opponent’s reception ) and the dataset-wide breakpoint rates by serve quality.
ExpBP% is calculated in the same way as expected sideout percentage %.
Another interesting twist on serving statistics is to look at opponent reception against a particular server. That is the opponent expected SO% (opp.expSO%). This looks at serving from the perspective of the recievers, the main difference being that service errors are therefore no longer included.
With these five statistics, and understanding the relationships between them, we can simply and elegantly analyse every team component of the game.

2 comments