
With a little extra time on my hands I have taken started to look at what might be the differences and similarities between leagues, and with it whether there are any structural ‘rules’ in volleyball. Thanks to Michael Mattes and Manlio Puxeddu, who collected the files and Ben Raymond, who wrote the apps that let me crunch the numbers for the whole leagues. The leagues I will focus on are France, Germany, Italy, Poland, and Russia. For these leagues, I have almost full data for the 2016-17 season and I also think these are probably the top 5 leagues right now.
Everybody knows that the team that makes the least errors wins. It is one of the great truisms of sports, handed down to us from time immemorial by the great coaches of history. Following this immutable, dare I say conventional, wisdom, innumerable coaches in countless sports all of the world daily exhort their charges to reduce errors. Everybody knows this to be true.
But do they actually know this? To my knowledge, nobody has ever tested the hypothesis that reducing errors leads to more wins. And EVERY (ok, most) sport counts and decides their results based on points / goals / games won. No sport is decided by adding up the errors avoided. Surely on this basis alone we have reason to question the conventional wisdom. And you know how much encouragement I need to question conventional wisdom.
Some time ago, I started working with a number that adds total errors and points, using a ‘per 100 points’ scale. The details of that are here, but simply I group all unforced errors (serving, setting, attacking, net touches in block, free ball reception errors) on one side and won points (serving, attacking, blocking) on the other. The ‘per 100 points’ scale was chosen due to pointlessness of using totals or per set totals and the difficulty in using percentages of total actions (the actual number of actions that end rallies is very small). I have followed this statistic for over a year now and I did some correlations in the top 5 leagues. What have I found?
ERRORS AND POINTS PER 100 POINTS

The number of errors and points made by teams is remarkably consistent across the five leagues. The average number of errors is roughly 15, and the average number of points made is roughly 35. You can see that above in probably the most boring graph of all time. The very slight difference is the lower error rate in the French league.
CORRELATIONS TO SET WIN PERCENTAGE
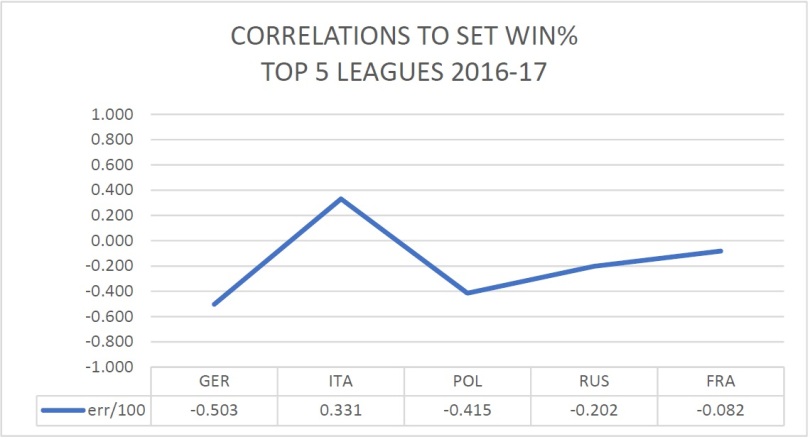
When we look at the correlations between error rate and set win percentage, we see that there is little to no relationship between the two. In France and Russia, the correlations are very small. In Germany and Poland there is a mild negative correlation (i.e. the more errors you make you less likely you are win), while in Italy there is a mild POSITIVE correlation (i.e. the more errors you make the MORE likely you are to win).

When we look at correlations between points won and set win percentage we see a very strong correlation, in every league. The figures are so high that there is not really any discussion to be had, scoring more points makes more likely to win.
The conventional wisdom is that by avoiding errors you give your opponent more chances to make errors themselves. Using the same argument, by avoiding errors you not only give up chances to make points for yourself but you also give your opponent more opportunities to make points. As always, everything is perspective and statistics themselves are only one perspective.
One thing is clear, avoiding errors ALONE is a poor strategy. Errors are not a problem as long as they are in the service of making a point. And scoring points is the name of the game.
For previous posts in this series on the Top 5 Leagues click here, here, here, here, here, here, here, here and here.
The collection of Coaching Tips can be found here.
For more great coaching tips, check out the Vyacheslav Platonov coaching book here.


Questions for my understanding:
How can the total of rally ending errors and rally ending points not be 100? Is a rally not either ended by error or by point?
I read in the other post, that you count block points as points for the blocking team. Would the outcome of this analysis change if you counted blocks as “attack errors”?
LikeLike
Re blocks… I would argue very strongly that block points are NOT attack errors and should never be considered as such.
But for the sake of argument the first difficulty is that you would be counting the same action for both sides of the equation. You could conceivably make the same / similar argument to include reception errors as errors. Unless you started to decide which actions are errors or points individually which is in practice impossible to do.
To answer the question directly, I suspect the number of blocks is a relatively number and so would not have a significant impact.
LikeLike
Questions for my understanding:
How can the sum of errors per rallies and points per rallies not add up to 100? Is a rally not either ended by error or by point?
I read in the other post that you count successfull blocks as points. Would the outcome of this here change, if you counted blocks as “attack errors”?
LikeLike
It should add up to 100. We didn’t/couldn’t control every single file in the dataset so there are sure to be some errors in the files that are reflected here. There are also some quirks that happen that are dealt with differently by different scouts. For example, a lot of scouts don’t record red cards. They simply leave it as a blank rally. Others will record it as an error. Some scouts record block net touches as also attack points.
There are some inconsistencies but over the tens of thousands of rallies I assume those differences are minor.
LikeLike